Notes from Andy Grove’s High Output Management

Love this book, for the clarity of operations principles, and the impact of that to managerial decisions.
Also, I’m a huge fan of Grove’s Motivation vs. CUA matrix.
It seems to me that Grove’s book has two themes: (1) How to approach operations, and (2) How that translates to effective team management. These notes focus on the former.
EXCERPTS FROM BOOK:
Understanding your production process
- What is important is the thinking you force yourself to go through to understand the relationship between the various aspects of your production process.
- Find leverage through Work simplification. To get leverage this way, you first need to create a flow chart of the production process as it exists. Every single step must be shown on it, no step should be omitted in order to pretty things up on paper. Second, count the number of steps in the flow chart so that you know how many you started with. Third, set a rough target for reduction of the number of steps. In the first round of work implication, our experience shows that you can reasonably expect a 30-50% reduction. To implement the actual simplification, you must question WHY each step is performed
Design for the limiting step
- The first thing we must do is to pin down the step in the flow that will determine the overall shape of our operation: the limiting step
- The key idea is that we construct our production flow by starting with the longest (or most difficult, most sensitive, most expensive) step and work our way back.
Understand & evaluate tradeoffs
- Specialists– leads to overhead
- Offload to others–“But when you have to depend on someone else, the results are likely to be less predictable”
- Equipment capacity, manpower, inventory can be traded off against each other and then balanced against delivery time
- Your task is to find the most cost effective way to deploy your resources— the key to optimizing all types of productive work. There is a right answer: the one that can give you the best delivery time and product quality at the lowest possible cost. To find that right answer, you must develop a clear understanding of the tradeoffs between the various factors (e.g. manpower, capacity, inventory) and you must reduce the understanding to a quantifiable set of relationships.
How to assess quality / performance?
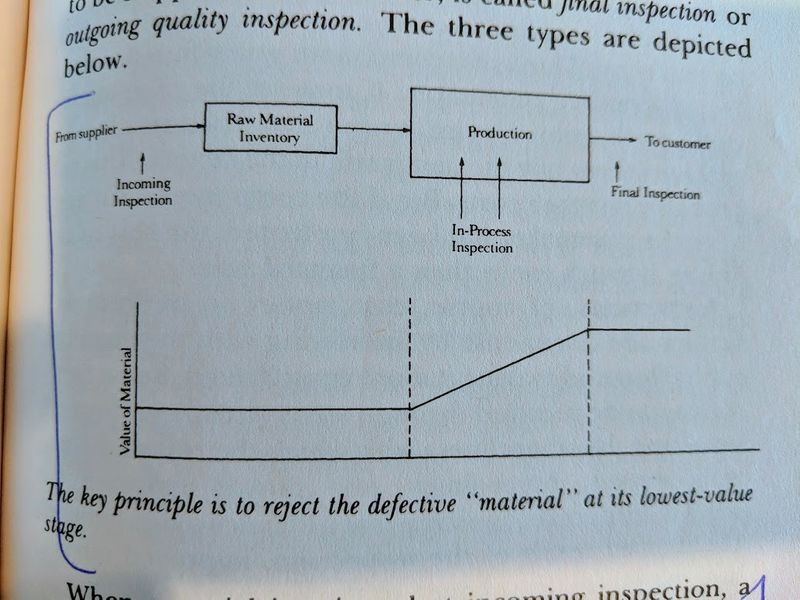
- Incoming / receiving inspection
- In-process inspection (the point is that whenever possible you should choose in process tests over those that destroy product)
- Functional test— if fail test, material must be “reworked”
- All production flows have a basic characteristic: the material becomes more valuable as it moves through the process.
- A common rule we should always try to heed is to detect and fix any problem in a production process at the lowest value stage possible
Different ways of quality inspection
- Gate-like inspection— all material held until inspection tests completed
- Monitoring— a sample is tested. The bulk of the material is not held as the sample is taken but continues to move through the process. The smoothness of the flow is maintained, but, if ~3 successive samples fail the test, we can stop the line.
- Clearly for the same money we can do a lot more monitoring than gate type inspections
- Another way to lower the cost of quality assurance is to use variable inspections. Because quality levels vary over time, it is common sense to vary how often we inspect. If bad, ramp up intervals
Making decisions based on test results
- Ideally inventory should be kept at the lowest value stage. When material is rejected at incoming inspection, a couple of choices present themselves.
- How to address? We can send it back to the vendor as unacceptable, or we can waive our specifications and use the substandard material anyway. Such decisions can only be made properly by a balanced group of managers.
- Also try to gauge the opportunity at risk: what would it cost you if you had to XYZ? how would impact customer renewal?
Understand progress
- Think of production process as a black box. Then cut in windows that can observe the process. By looking through the openings we can better understand the internal workings of any production process and assess what the future output is likely to be. Leading indicators give you one way to look inside. But, must believe their validity
- Use staggered progress charts. Understanding the variance of the forecast incredibly useful. The stagger chart forecasts an output over the next several months. The chart is updated monthly, so that each month you have an updated version of the then-current forecast information as compared to several prior forecasts. You can readily see the variation of one forecast form the next, which can help you anticipate future trends better than if you use da simple trend chart. The improvement or deterioration of the forecasted outlook from one month to the text provides the most valuable indicator of business trends that I have ever seen. Finally, indicators can be a big help in solving all types of problems. If something goes wrong, you will have a bank of information that readily shows all the parameters of your operation, allowing you to scare them for unhealthy departures from the norm.
- It is a good idea to use stagger charts in both the manufacturing and sales forecast. As noted, they will show the trend of change from one forecast to another, as well as the actual results. By repeatedly observing the variance of one forecast from another, you will continually pin down the causes of inaccuracy and improve your ability to forecast both orders and the availability of product.
Indicators, measurements are a key tool
- You have to focus each indicator on a specific operational goal
- e.g.: forecast, variance between plan and actual delivery, inventory, condition of equipment, manpower, quality
- Indicators tend to direct your attention toward what you are monitoring. So, you should guard against overreacting. This you can do by pairing indicators, so that together both effect and counter effect are measured. For example: monitor both inventory levels and incidence of shortages.
- Watching this pair of indicators should help us to avoid working on the perfect compiler that will never be ready, and also to avoid rushing to finish one that is inadequate. For quantity or output indicators, paired counterparts should stress the quality of work.
Localize decision making
- Try to localize decision making; any decision to be worked out and reached at the lowest competent level.
- The reason is that this is where it will be made by people who are closest to the situation and know the most about it. Best to pair TECHNICAL knowledge with also JUDGEMENT of what will work/ will not.
On designing for motivation
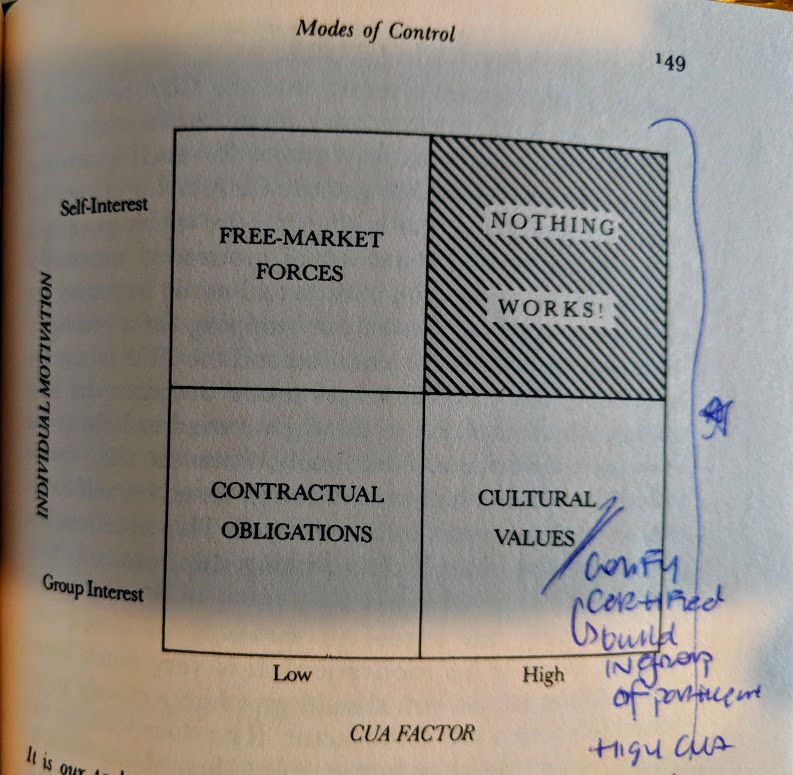
- People’s behavior can be controlled by 3 invisible and pervasive means:
- free market forces (self interest, incentive)
- contractual obligations
- cultural values
- There is always a “most appropriate” mode of control to find and use.
- Two variables to evaluate most appropriate: (1) the nature of a person’s motivation (2) the nature of the environment in which he works— complex, uncertainty, ambiguity (CUA factor)
Highly recommend.