Why a Diagram is (Sometimes) Worth 10k Words– Larkin & Simon

Caught my attention for love of diagramming. Stayed for the relationship between spatial & relational mapping, plus effective 80-20-esque impacts to search
Pointer from: WikiQuotes link from Herb Simon
Link: https://onlinelibrary.wiley.com/doi/pdf/10.1111/j.1551-6708.1987.tb00863.x
EXCERPTS
- Sentential representations are sequential, like the propositions in a text
- Diagrammatic representations are indexed by location in a plane
- When two representations are informationally equivalent, their computational efficiency depends on the information-processing operators that act on them
- Most important, however, are differences in the efficiency of search for information and in the explicitness information
- In the representations we call diagrammatic, information is organized by location, and often much of the information needed to make an inference is present and explicit at a single location. In addition, cues to the next logical step in the problem may be present at an adjacent location. Therefore problem solving can proceed through a smooth traversal of the diagram, and may require very little search or computation of elements that had been implicit.
- The advantages of diagrams, in our view, are computational. That is diagrams can be better representations not because they contain more information, but because the indexing of this information can support extremely useful and efficient computational processes. But this means that diagrams are useful only to those who know the appropriate computational processes for taking advantage of them.
- Furthermore, a problem solver often also needs the knowledge of how to construct a “good” diagram that lets him take advantage of the virtues we have discussed
- MY ADD: i.e. depends on the task environment. for example, remember better if mechanisms for remembering same format as what will be tested on (e.g. practice as multiple choice if test is multiple choice.) AKA choose the best tool for your task environment
- Although the data structures we shall postulate are stored externally, on paper, the productions that operate on them are in the problem solver’s memory
- The nature of attention management depends crucially on the linkages provided in the data structure since this is the only information available for guiding shifts in attention
- The program operating on the data structure employs the following kinds of processes: (1) Search operates on the node-link data structures, seeking to locate sets of elements that satisfy the conditions of one or more productions. This process requires attention management. (2) Recognition matches the condition elements of a production to data elements located through search. Recognition depends on a match between the elements in the data structure and the conditions of the productions in the program. (3) Inference executes the associated action to add new (inferred) elements to the data structure.
- How do sentential and diagrammatic representations, respectively, affect the three components of information processing mentioned above: search, recognition, and inference?
- Human ability to recognize information are highly sensitive to the exact form (representation) in which the information is presented to the senses (or to memory)
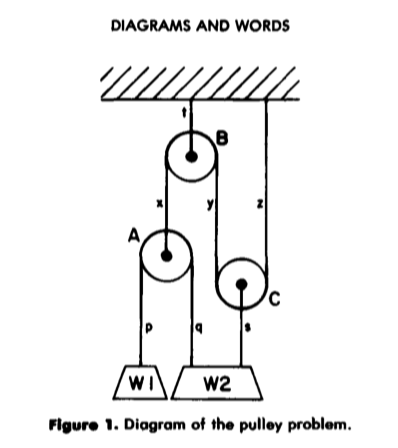
- To make concrete our comments about differences in computational efficiency for two problem representations containing identical information, we work here a simple example from physics. In this example we will see, for the diagrammatic representation, considerable computational advantages in search, plus a subtle advantage due to different needs for labeling
- Criteria for the utility of diagrams
- Locality
- Minimizing labeling
- Use of perceptual enhancement
- In conclusion:
- Diagrams can group together all information that is used together, thus avoiding large amounts of search for the elements needed to make a problem-solving inference.
- Diagrams typically use location to group information about a single element, avoiding the need to match symbolic labels.
- Diagrams automatically support a large number of perceptual inferences, which are extremely easy for humans.